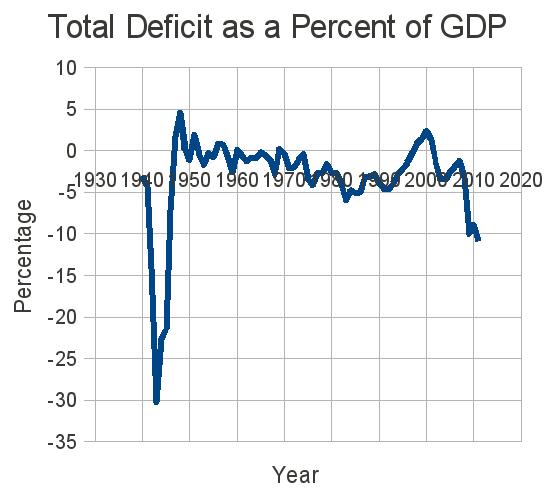
Living in Iowa, we have been inundated with Republican candidates’ political ad’s about our “out of control” deficit. Below, I have graphed the United States budget deficit as a percentage of the gross domestic product from 1940 to to 2011. The 2011 figures are estimated and the data can be found at the Office of Management and Budget website under Historical Tables, http://www.whitehouse.gov/omb/budget/Historicals.
As one can see, we have been in a deficit most of the time since 1940. The exceptions are the years 47, 48, 49, 51, 56, 57, 60, 98, 99, 00, and 01. The deficit used is the total deficit rather than the on balance deficit. Excluding the years around WWII and the years after the crash at the end of G. W. Bush’s administration, I calculated the average size of the deficit as a percentage of GDP by which party had the presidency (for the years 1947 to 2008.) The deficit and GDP are associated with the year at the end of the fiscal year for which the deficit and GDP are calculated. Since the budget is put together the year before, I used the party of the president of the year before the data for the deficit as a percentage of GDP. For example, the value of the deficit as a percentage of GDP for 1953 is associated with Truman, who was president in 1952, rather than with Eisenhower, who was president in 1953. The mean (standard deviation) for democratic presidents was -0.47 (1.84) and for the republican presidents -2.50 (1.81).
I will say that the huge deficits that were run during WWII did not hurt the future economy, and, perhaps, shocked the economic system out of the great depression. Perhaps we are in a similar situation now, where large deficit spending would shock us into good growth. However, after WWII, the United States was the engine for world growth as the world recovered. I do not believe we are in a similar situation now.

