There are a number of different ways of measuring the money supply. Five ways that I know of are M0, M1, M2, M3, and the monetary base. Money supply measures estimate the amount of available monetary resources in the economy. The measures do not include money available through credit, since such money must be payed back. Some of the monetary measures include the various types of savings deposits. All of the monetary measures include the currency of our country. From the Wikipedia page, Money Supply , M0 is mainly the physical money in circulation, M1 is mainly M0 plus checking accounts of various kinds, M2 is mainly M1 plus most savings accounts, money market accounts, and CD’s of value less than $100,000, M3 is mainly M2 plus CD’s of value greater than $100,000, time deposits in foreign banks denominated in US dollars, and repurchase agreements. Also from the Wikipedia page, the monetary base is the physical currency plus minimum and excess reserves of the Federal Reserve Banks.
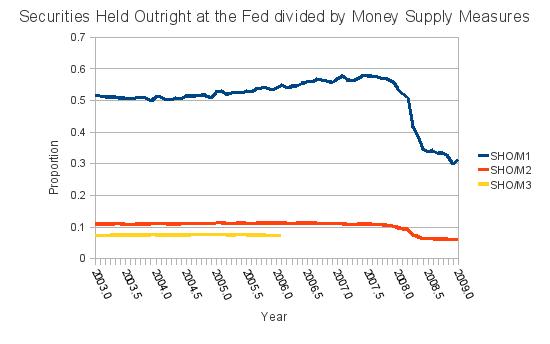
Below, I have plotted Securities Held Outright from historical data of the Federal Reserve (see http://www.federalreserve.gov/releases/h41/current/) divided by historical data for M1, M2, and M3 (see http://www.federalreserve.gov/releases/h6/current/) for the years 2003 to 2009. The data is not seasonally adjusted. According to a note in the Wikipedia page, Federal_Reserve_System , Securities Held Outright under the listing of Federal Reserve assets previously represented the part of the federal public debt that the Federal Reserve owned, that is the money that the Federal Reserve has created. According to the note, in 2007 and 2008, some facilities were added and, after that time, Securities Held Outright was not the federal public debt owned by the Federal Reserve banks. I only found data back to late in 2002 for Securities Held Outright. Securities held outright are reported weekly. I used the average for the first week of the month to plot against monthly money supply data. For the money supply measures, the M3 series ends in February of 2006. The Bush administration felt that measuring M3 was not worth the cost.
 Securities Held Outright are about 11% of M2. The reserve ratio for a bank depends on the size of the bank and the type of deposits in the bank. This year, 2012, for transaction accounts, if a bank holds under $11.5 million, there is no reserve requirement. If a bank holds between $11.5 million and $71.0 million in transaction accounts, the reserve ratio is 0.03. If a bank holds more than $71.0 million in transaction accounts, the reserve ratio is 0.10. While the levels where the two reserve ratios go into effect change each year, the 0%, 3%, 10% split has been law since 1982. There other types of accounts have no reserve requirement. See http://www.federalreserve.gov/monetarypolicy/reservereq.htm for information on the historical levels of the breaks (tranches), for a description of transaction accounts, and for information about the other types of accounts which have no reserve requirement.
According to the description of transaction accounts in the Federal Reserve page linked in the last sentence, transaction accounts are essentially M1. The components of M2 and M3 in excess of M1 do not have reserve requirements. We see the ratio of Securities Held Outright by the Federal Reserve banks – that is , the money the government has created out of thin air – in a ratio of about 0.10 with M2 and M3. So, even though there is no reserve requirement on M2 or M3, overall financial institutions seem to have been loaning out money at a defacto reserve rate of about 10%, that is, the money supply is about ten times the amount of money that the Federal Reserve banks have created out of thin air.
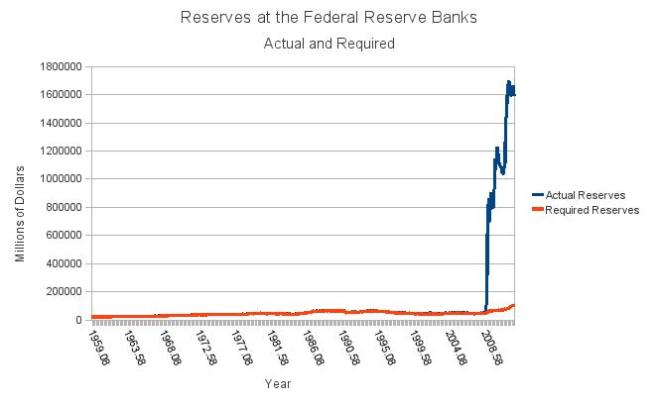
Below, I have plotted the actual and required reserves from 1959 to the present. The source of the data can be found at http://www.federalreserve.gov/releases/h3/current/h3.htm . The reserves that I have plotted are not adjusted for seasons or breaks. I have made two plots, since there has been a huge change in both the size and behavior of the reserves since 2008.
In 2008, the Federal Reserve banks began paying interest on excess reserves held at the banks. I am assuming the interest is the reason reserves have increased so much. I wonder what the effect has been on the money supply, since I would think that banks would have less money available to lend. There is an interesting paper of reserves written in 1993 at the Federal Reserve, a link to which can be found at http://www.federalreserve.gov/monetarypolicy/reservereq.htm, under ‘article (119 KB PDF)’.


